Connect API & Operations
UtilMeta framework has a built-in API service management system, which can easily observe and manage local and online API services, and provide a series of features including Data CRUD, API management, Logs query, Monitoring, Testing, Alerts & Incidents, etc. This document will introduce the configuration of UtilMeta Operations system and how to connect to UtilMeta platform in detail.
Configuration
UtilMeta's API service management system is using the configuration at utilmeta.ops.Operations, you can just import and use service.use to configure to the service, as shown in
from utilmeta import UtilMeta
from utilmeta.core import api
import starlette

@api.CORS(allow_origin='*')
class RootAPI(api.API):
    @api.get
    def hello(self):
        return 'world'

service = UtilMeta(
    __name__,
    name='demo',
    backend=starlette,
    api=RootAPI,
    route='/api'
)

from utilmeta.ops import Operations
service.use(Operations(
    route='ops',
    database=Operations.Database(
        name='operations_db',
        engine='sqlite3'
    ),
))

app = service.application()  # wsgi app

if __name__ == '__main__':
    service.run()
Note
Using Operations config requires UtilMeta version >= 2.6.1
The main parameters of the Operations configuration include
-
route: Required. Specify the route for mounting the OperationsAPI of the management system. This route is relative to the root API of your service. For example, if your root API is mounted athttp://mysite.com/api. Settingroute=’ops‘will mount the Operations API to thehttp://mysite.com/api/ops -
database: Required. Set the database for the management system to store logs, monitoring and other operations data. You can simply specify a SQLite database as in the above example, or use apostgresqldatabase in the production environment.
Tip
If you are using MySQL or PostgreSQL, don't forget to set connection params like host, port, user, password
base_url: Specify a base API location for your API service that can be accessed on the network. This location will be used for generatingserver.urlin OpenAPI documentation, after settingsbase_url, the location of OperationsAPI will bebase_url+route
Note
It's a comman practice that your API service is listening to the private or local address, and providing access to the Internet through a reverse proxy or gateway like Nginx. In this case, the auto-generated base URL will be your private location, like http://127.0.0.1:8000/api, which cannot be accessed in the network, so you need to specify the REAL location of your service using base_url, like https://mysite.com/api, so that the generated API document will provide the urls that can be accessed from the Internet
Warning
When your base_url contains path, like http://mysite.com/api, any API path in your service with the /api prefix will be generated to the document, for example: the path of /api/user API in the document will be /user, Otherwise your API will not be merged into the document, such as /settings
Warning
If you are using 0.0.0.0 as host, please set a accessiable location in base_url, or your service will not be able to connect to the UtilMeta platform
Task and Monitoring
-
worker_cycle: Operations system will start a task thread in each process (worker) after the service started, which is used to collect and store request logs, monitor service data and sending alarms, etc. You can use theworker_cycleparameter to specify the interval (intdescription ortimedelata) for these tasks to run each time. The default is 30 seconds, which means that the request log of each process will be persisted every 30 seconds by default. Database and service instance monitoring and alerting triggers every 30 seconds -
max_backlog: Set the maximum backlog of the request log. In addition to eachworker_cyclepersistent log of the operations task, when the backlog of unstored logs in your process exceedsmax_backlog, it will also trigger log storage. The default is 100. -
secret_names: The log module of the operations system will store the request and response data for debugging when the request goes wrong (throwing an exception and returning a status code of 400 or above). For data security, you can specify a series of field names that may contain keys or sensitive data. When the log is stored, The request parameter, request body, request header, response body, and response header fields will be used'******'instead if the field name is detected to contain any of them. The defaultsecret_namesisDEFAULT_SECRET_NAMES = ( 'password', 'secret', 'dsn', 'sessionid', 'pwd', 'passphrase', 'cookie', 'authorization', '_token', '_key', ) -
max_retention_time: Specify the maximum storage time of all time series data in the operations system. Time series data include logs, service monitoring, alarm records, version logs. Data with stored time exceeding this time will be cleared. For subdivided data categories and status, more specific storage time configuration will be introduced below.
Manage permissions configuration
disabled_scope: Disabled operations scope. If you do not want an operation to be used by any administrator, you can use this option to disable it. The default is blank.local_scope: Permission granted by the local node. Local management refers to managing local services onlocalhost/127.0.0.1, so the default permission is('*',), that is allow all permissions. If you set this value to null or None, Indicates that all local administrative operations will not be allowed
The current UtilMeta server side permission scope and the corresponding meanings are as follows:
api.view: View the API documentation of the servicedata.view: View the data model and table structure (field names, types, etc. Of the table, excluding the data in the query table)data.query: Query the data in the table, and support field querydata.createCreate data, that is, insert data into a tabledata.update: Update datadata.delete: Delete datalog.view: Query loglog.delete: Delete the logmetrics.view: Query the monitoring data of the service
Log configuration
The Log module of the operations system is responsible for recording and querying the request logs. The configuration of the log module allows you to control the storage of the log.
Parameter log in the Operations configuration can be passed to the configure the logging module, such as
from utilmeta.ops import Operations
service.use(Operations(
    route='ops',
    database=Operations.Database(
        name='operations_db',
        engine='sqlite3'
    ),
    log=Operations.Log(
        default_volatile=False,
        exclude_methods=['head'],
        exclude_statuses=[301, 302, 404]
    )
))
Log configuration parameters include
default_volatile: Whether the default is marked asvolatile(not saved for a long time, will be cleared after aggregation)volatile_maintain: The storage time of the log marked asvolatile, specify atimedelta. The default is 7 days.
Tip
To avoid redundant logs in the storage, the regular logs (no error, no event) can be deleted after aggregation (calculate request counts), Every log will calculate volatile mark during storage, the logs marked as volatile=True will be deleted after volatile_maintain period of time
Log storage rules
persist_level: When the request log reaches a certain level, it will be persisted. The default is WARN.
Tip
UtilMeta logs is categorized into DEBUG, INFO, WARN, ERROR, corresponded to 0, 1, 2, 3, an request with no error and a response with status code under 399 will be categorized to INFO by default, 4XX will be WARN level and 5XX will be ERROR level
persist_duration_limit: Persist a log if the duration of response exceeded this threshold. A number of seconds is passed in. The default is 5 seconds.store_data_level: Store a log's request body data if log level exceeded this levelstore_result_levelStore a log's response data if log level exceeded this levelstore_headers_level:Store a log's request and response headers data if log level exceeded this level
Tip
If service is in production mode ( production=True), The three above parameters will be WARN, meaning that production service will only store body and headers data at WARN or above level by default, a debug service will store all data by default.
exclude_methods: Exclude the log storage of some HTTP methods if there are no errors. Default isOPTIONS,HEAD,TRACE,CONNECTexclude_statuses: Exclude the log storage of some response status codes If there is no error, the default is empty.exclude_request_headers: If the request header contains one of these values, the log will not be stored if there is no error. The default is empty.exclude_response_headers: If the response header contains one of these values, the log will not be stored if there is no error. The default is empty.
Log display rules
hide_ip_address: For data security or privacy protection, you can choose to turn on this option, and the IP address of the log will not be seen on the UtilMeta Platform.hide_user_id: For data security or privacy protection, you can choose to enable this option, and the user ID information of the log will not be seen in the UtilMeta Platform.
Monitor configuration
The Monitor module of the operations system will monitor the server, service instance, service process, database, cache and other resources on which the service depends (On the cycle configured by the worker_cycle), and store the data in the database configured by Operations.
Parameters monitor in the Operations configuration can be passed to configure the monitoring module, such as
from utilmeta.ops import Operations
from datetime import timedelta

service.use(Operations(
    route='ops',
    database=Operations.Database(
        name='operations_db',
        engine='sqlite3'
    ),
    monitor=Operations.Monitor(
        server_retention=timedelta(days=30)
    )
))
Configuration parameters for Monitor include
server_disabled: Whether to disable the monitoring of server. The default is False.instance_disabled: Whether to disable the monitoring of service instance. The default is False.worker_disabledWhether to disable monitoring of the service workerdatabase_disabled: Whether to disable the monitoring of database. The default is False.cache_disabled: Whether to disable the monitoring of cache. The default is False.
Service Instance | Service Worker
In UtilMeta, Service Instance is a runing process group that can handle API requests, a service instance con contains multiple Service Workers, (depends on the workers param of deployment configuration), Service instances and service workers will record Requests, Avg response time, Traffic and CPU/Memory usage in each monitor cycle
server_retention: Storage time of Server monitoring metrics, accpet atimedelta, 7 days by defaultinstance_retention: Storage time of service instance monitoring metrics, accept atimedelta, 7 days by defaultworker_retention: Storage time of service worker monitoring metrics, accept atimedeltaand defaults to 24 hours.database_retention: Storage time of database monitoring metrics, accept atimedelta, 7 days by defaultcache_retention: Storage time of cache monitoring metrics , accept atimedelta, 7 days by default
Tip
Monitor time series data will be cleaned up after the above corresponding retention time
OpenAPI configuration
For the API developed with UtilMeta framework and other supported frameworks (like DRF, FastAPI, Sanic, APIFlask) , UtilMeta operations system can automatically identify and generate OpenAPI documents to synchronize to the UtilMeta platform, but if the framework you use does not support the automatic document generation, or if you need to inject additional API documents, you can use the openapi param of Operations configuration, which can be in the following format
- A URL to the OpenAPI documentation that can be accessed and downloaded
- The location of a local OpenAPI documentation file
- An OpenAPI JSON/yaml string
- An OpenAPI dictionary
- A list of API documents, where the element can be any of the above format
For example:
from utilmeta.ops import Operations
from datetime import timedelta

service.use(Operations(
    route='ops',
    database=Operations.Database(
        name='operations_db',
        engine='sqlite3'
    ),
    openapi='/path/to/openapi.json',
    # openapi='https://mysite.com/openapi.json',
    # openapi={...},
))
The additional specified OpenAPI document will be integrated with the automatically generated API document and synchronized to the UtilMeta platform.
Connect to UtilMeta Platform
UtilMeta provides a platform for the observation and management operations of the API services: UtilMeta Platform you can enter the platform to connect and manage your UtilMeta service (or other services with supported frameworks), view API documents, data, logs and monitoring.
Connect Local API
If you have configured the Operations successfully and run the local service, you can see the following prompt
UtilMeta OperationsAPI loaded at http://127.0.0.1[...], connect your APIs at https://ops.utilmeta.com/localhost?local_node=http://127.0.0.1[...]
You are ready to connect to the local node for debugging, just click the second link in the service output, or run the following command inside the service directory (the directory containing meta.ini)
meta connect
Note
supported on UtilMeta >= 2.6.2
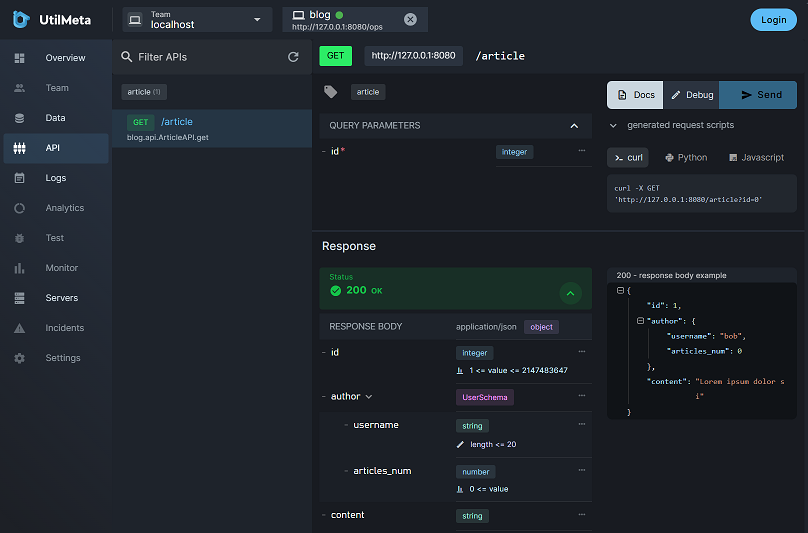
You can see that the browser opened a window of UtilMeta platform, where you can see the APIs, Data tables, log and monitoring of your service.
Cookie
When you connecting local API directly, it is not possible to directly send cookies from the browser to API service (because the UtilMeta platform is cross domain with local service). Connecting to online public services will not have this problem because requests can be forwarded through the UtilMeta platform. In the future, UtilMeta platform will launch browser plugin and desktop client to solve the problem. Currently, you can use UtilMeta's declarative web client to write debugging scripts and test cases for local APIs with cookies.
Connect Public Service
Connecting to the API service deployed online with public network address requires you to register an account on the UtilMeta platform. Because the management of online services requires a stricter authorization and authentication mechanism, you need to create a project team on the UtilMeta platform first. When you enter an empty project team, You can see the connection prompt for the UtilMeta platform
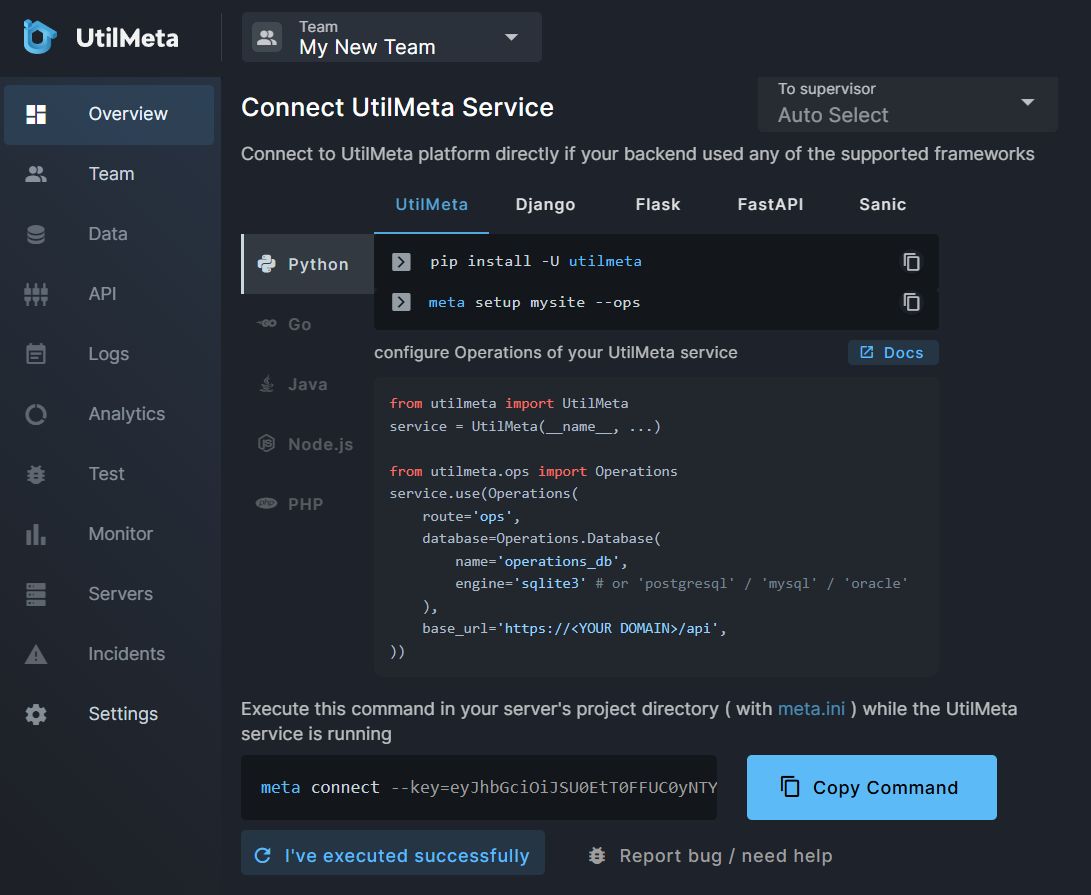 If you have followed the above configuration method, you can directly copy the command given by the UtilMeta platform and execute the command inside the project directory (the directory containing
 meta.ini) in your server. If the command is successfully executed, you will see a URL output from the console.
connecting: auto-selecting supervisor...
connect supervisor at: https://api-sh.utilmeta.com/spv
supervisor connected successfully!
please visit [URL] to view and manage your APIs'
Click the URL to access the online service you have connected in UtilMeta Platform, or click the I’ve executed successfully button in the platform to refresh after successful execution
Connect Intranet Cluster (by proxy)
In addition to manage API services on the public network, we sometimes need to manage API services in private network clusters, such as internal services within the company's intranet, which do not have public IP addresses or access URLs. To manage these internal network services, we need to set up public network proxies in the internal network cluster, deploy a proxy service node for internal network penetration with authentication and service registration.
UtilMeta has provided an open source proxy service utilmeta-proxy
There are also a guide for connect and manage internal cluster in UtilMeta Platform, click Add Cluster and you can follow the popup guide
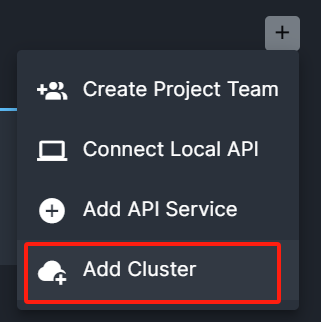
Following the step-by-step instructions you can easily set up an intranet proxy node for the cluster and connect it to the UtelMeta platform. Afterwards, the services in the cluster only need to be configured to connect to the proxy node, without manually connecting to the platform. The proxy node will act as the service registration center for the intranet cluster and synchronize with the UtilMeta platform
In Operations configuration, the proxy parameter can be used to configure the address and settings of the proxy service. The main parameters include
base_url: The public URL address of the proxy node, which will be automatically generated after adding the cluster and setting the proxy domain nameforward: Whether to forward the proxy node's outbound management synchronization requests, such as synchronizing source information, reporting data, alarm notifications, etc. This parameter needs to be set to True when the internal network node cannot send requests to the public network address`
from utilmeta import UtilMeta
service = UtilMeta(__name__, ...)

from utilmeta.ops import Operations
from utilmeta.conf import Env

env = Env(file='utilmeta-proxy.env')

service.use(Operations(
  route='ops',
  database=Operations.Database(
      name='utilmeta_proxy_ops',
      host=env.get('UTILMETA_OPERATIONS_DB_HOST'),
      port=env.get('UTILMETA_OPERATIONS_DB_PORT'),
      engine=env.get('UTILMETA_OPERATIONS_DB_ENGINE'),
      user=env.get('UTILMETA_OPERATIONS_DB_USER'),
      password=env.get('UTILMETA_OPERATIONS_DB_PASSWORD'),
  ),
  proxy=Operations.Proxy(
      base_url=env.get('UTILMETA_PROXY_BASE_URL'),
      forward=False
  ),
  base_url='http://$IP/api'
))
Note
UtilMeta services in the cluster should share the same Operations database as the proxy service, this database will serve as the service authentication basis and management storage center in the cluster. Current version mainly support PostgreSQL and MySQL as operations storage, futher releases will support other storage vendors.
Connect Private Service (directly)
Beside the proxy mode in the above section, UtilMeta also provided a method to connect service node in the private network directly, similiar to connecting local API, with two conditions required:
- Your management client (the computer that opened the UtilMeta Platform) must located at the same private network with the service you are going to manage. which means your computer can directly access the private service's API.
- Your private service should provide HTTPS access (with SSL certificates)
Note
In the site that served with HTTPS (i.e. UtilMeta platform), browser will block all http requests (except for localhost), as you can see in the Mixed Content | MDN, so to connect to the private service directly, you should use the HTTPS protocol
After meeting the above conditions, you need to add two additional configurations for Operations:
connection_key: In order to ensure the security of private network nodes, directly connecting to private network nodes requires you to pre-set a key (preferably a long random string) in the Operations configuration. UtilMeta will first verify this key for management requests from the private network, and only execute the corresponding request after verification is successful.private_scope: Authorize the permission range for private network requests. The value of the permission range can refer to the introduction in the'local_scope'section above. If you need to grant all permissions, you can use['*']
The configuration example is as follows:
from config.env import env
from utilmeta.ops import Operations

service.use(Operations(
    base_url='https://my-private-service.com/api',   # replace with your domain
    # other settings...
    connection_key=env.CONNECTION_KEY,
    private_scope=['*']
))
Noted that base_url should also need to set to the address with HTTPS protocol and domain name.
Note
Connect to private network service directly requres UtilMeta >= 2.7.5
After the configuration, restart your service and you will see the OperationsAPI URL in the output
UtilMeta OperationsAPI loaded at https://my-private-service.com/api/ops
Then we can login to UtilMeta Platform, enter your project team, click the [Connect Local API] of [+] button on the top bar
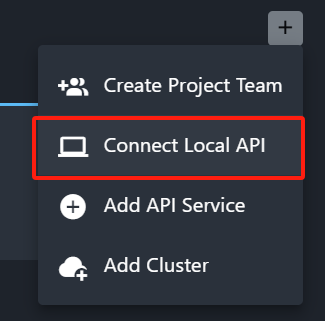
Enter the OperationsAPI URL of your service in the prompted dialog, (for example: https://my-private-service.com/api/ops)
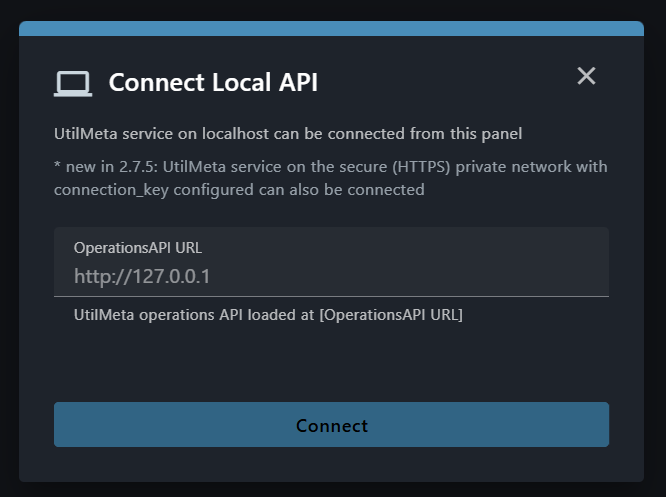
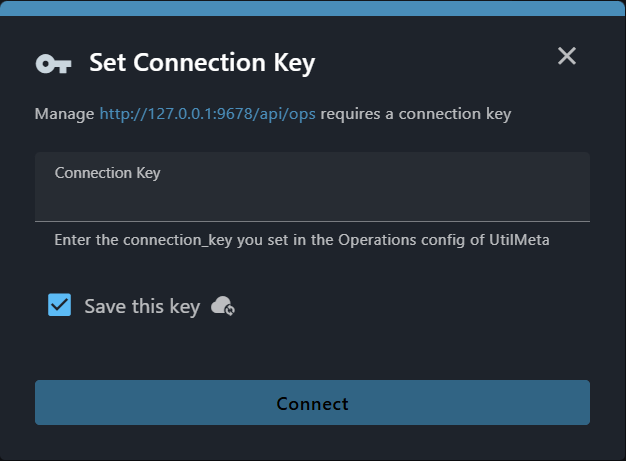
If you connected successfully, UtilMeta platform will prompt you to enter the connection_key you configured in the service, enter the correct key then you will be connected to your private service directly
Note
With "Save the key" checked, you can save the connection_key and OperationsAPI address of the private service to your project team, you won't need to enter these info again to connect to this service next time.
Connect to Python project
The operations system of UtilMeta framework can not only connect to the services made by UtilMeta framework, but also connect to the existing Python backend projects. The currently supported frameworks include
- Django: Includes Django REST framework.
- Flask: Include APIFlask
- FastAPI: Starlette included
- Sanic
Initialize UtilMeta project
Before connecting to any Python project, initialize the UtilMeta settings by simply going to your project folder and typing the following command
meta init
Then you will be prompted to enter the Reference of Python WSGI/ASGI application, for example for the following Django project
/django_project
    /django_settings
        wsgi.py
        settings.py
        urls.py
    manage.py
Django’s WSGI application is normally located at wsgi.py in the application, so you can enter django_settings.wsgi.app
For Flask / FastAPI / Sanic project, all you need is to find the reference of corresponding Flask(), FastAPI(), Sanic() application
The actual effect of executing this command is to create a file named meta.ini in your current directory with the following content
[utilmeta]
app = django_settings.wsgi.app
UtilMeta framework relies on this file to identify the UtilMeta project and project’s core application object.
Django
For the Django project, the WSGI application is normally located at wsgi.py and insert the Operations configuration integration code after the application = get_wsgi_application() definition
import os

from django.core.wsgi import get_wsgi_application

os.environ.setdefault('DJANGO_SETTINGS_MODULE', 'config.settings')

application = get_wsgi_application()

# NEW -----------------------------------
from utilmeta.ops import Operations
Operations(
    route='ops',
    database=Operations.Database(
        name='operations_db',
        engine='sqlite3'
        # or 'postgres' / 'mysql'
    ),
    base_url='https://<YOUR DOMAIN>/api',
    # base_url='http://127.0.0.1:<YOUR_PORT>',   # localhost project
).integrate(application, __name__)
We first declare the Operations configuration with the same parameters as described above, and then call the method of integrate. The first parameter is the WSGI/ASGI application, and the second parameter is __name__.
It should be noted that the base_url of Operations configuration need to be the absolute root url of your Django service, that is, the path defined in your API service will be extended from this URL, if it is deployed on the network. Set to a URL that can be reached on the network. For local service, set to http://127.0.0.1:[your port number]
After adding the configuration code and restart, if your project is running locally, you can see the connection url in the starting output of your service, you can connect the local service by entering the url to your browser
UtilMeta OperationsAPI loaded at [ops_api url], connect your APIs at [connection url]
or you can execute the following command to connect to the local service
meta connect
If your service provides network access, go to UtilMeta Platform , create a project team and follow the prompts to connect to the platform.
Django Ninja
Django Ninja inject itself to django project through urlpatterns, so UtilMeta cannot access the NinjaAPI application to generate API document, so you need to manually pass the document in Operations config.
As an example, for the following NinjaAPI
# urls.py --------
from ninja import NinjaAPI

ninja_api = NinjaAPI()

@ninja_api.get("/add")
def add(request, a: int, b: int):
    return {"result": a + b}

urlpatterns = [
    path("api-ninja/", ninja_api.urls),
]
We need to add a parse function for NinjaAPI at Operations config in wsgi.py
import os
from django.core.wsgi import get_wsgi_application
application = get_wsgi_application()

from utilmeta.ops import Operations
from .urls import ninja_api

Operations(
    route='ops',
    database=Operations.Database(
        name='operations_db',
        engine='sqlite3'
    ),
    openapi=Operations.get_django_ninja_openapi({
        "api-ninja/": ninja_api
    }),
    base_url='https://<YOUR DOMAIN>/api',
    # base_url='http://127.0.0.1:<YOUR_PORT>',   # localhost
).integrate(application, __name__)
The openapi parameter in Operations is used to specify additional API documentation. Here we directly call the get_django_ninja_openapi method to parse the NinjaAPI.
this method takes a dict parameter, the key of the dictionary is the path where NinjaAPI is mounted to urlpatterns, such as the 'api-ninja/' in the example above. The value of the dictionary is the corresponding NinjaAPI() instance. Since Django Ninja can create multiple NinjaAPI() instances, you can pass them into the function according to this rule
Flask
For the Flask project, we only need to integrate the Operations configuration to the Flask app, as shown in
from flask import Flask

app = Flask(__name__)

from utilmeta.ops import Operations
Operations(
    route='ops',
    database=Operations.Database(
        name='operations_db',
        engine='sqlite3' # or 'postgresql' / 'mysql'
    ),
    base_url='https://<YOUR DOMAIN>/api',
    # base_url='http://127.0.0.1:<YOUR_PORT>',   # 本地项目
).integrate(app, __name__)
Tip
If you are using APIFlask, you onle need to integrate the Operations config to app of APIFlask, UtilMeta will synchorize the OpenAPI document generated by APIFlask automatically
The base_url in Operations configuration need to provide the absolute root url of your Flask service, the path defined in your API service will be extended from this URL if it is deployed on the network. Set to a URL that can be reached on the network. For local service, set to http://127.0.0.1:[your port number]
After adding the configuration code and restart, if your project is running locally, you can see the connection url in the starting output of your service, you can connect the local service by entering the url to your browser
UtilMeta OperationsAPI loaded at [ops_api url], connect your APIs at [connection url]
or you can execute the following command to connect to the local service
meta connect
If your service provides network access, go to UtilMeta Platform , create a project team and follow the prompts to connect to the platform.
FastAPI
For the FastAPI project, we only need to integrate the Operations configuration to the FastAPI app, as shown in
from fastapi import FastAPI

app = FastAPI()

from utilmeta.ops import Operations
Operations(
    route='ops',
    database=Operations.Database(
        name='operations_db',
        engine='sqlite3'  # or 'postgresql' / 'mysql'
    ),
    base_url='https://<YOUR DOMAIN>/api',
    # base_url='http://127.0.0.1:<YOUR_PORT>',   # localhost
).integrate(app, __name__)
Tip
UtilMeta will synchronize the OpenAPI document generated by FastAPI automatically
The base_url in Operations configuration need to provide the absolute root url of your FastAPI service, the path defined in your API service will be extended from this URL if it is deployed on the network. Set to a URL that can be reached on the network. For local service, set to http://127.0.0.1:[your port number]
After adding the configuration code and restart, if your project is running locally, you can see the connection url in the starting output of your service, you can connect the local service by entering the url to your browser
UtilMeta OperationsAPI loaded at [ops_api url], connect your APIs at [connection url]
or you can execute the following command to connect to the local service
meta connect
If your service provides network access, go to UtilMeta Platform , create a project team and follow the prompts to connect to the platform.
Sanic
For the Sanic project, we only need to integrate the Operations configuration to the Sanic app, as shown in
from sanic import Sanic

app = Sanic('mysite')

from utilmeta.ops import Operations
Operations(
    route='ops',
    database=Operations.Database(
        name='operations_db',
        engine='sqlite3' # or 'postgresql' / 'mysql'
    ),
    base_url='https://<YOUR DOMAIN>/api',
    # base_url='http://127.0.0.1:<YOUR_PORT>',   # 本地项目
).integrate(app, __name__)
Tip
UtilMeta will synchronize the OpenAPI document generated by the Sanic openapi extension automatically
The base_url in Operations configuration need to provide the absolute root url of your Sanic service, the path defined in your API service will be extended from this URL if it is deployed on the network. Set to a URL that can be reached on the network. For local service, set to http://127.0.0.1:[your port number]
After adding the configuration code and restart, if your project is running locally, you can see the connection url in the starting output of your service, you can connect the local service by entering the url to your browser
UtilMeta OperationsAPI loaded at [ops_api url], connect your APIs at [connection url]
or you can execute the following command to connect to the local service
meta connect
If your service provides network access, go to UtilMeta Platform , create a project team and follow the prompts to connect to the platform.
UtilMeta Platform
UtilMeta Platform is a one-stop API service observation and management platform. This section mainly introduces its features and usage.
Overview
In the UtilMeta platform, users can create or join multiple Project Team, each team can connect and manage multiple API Services, and can also add multiple members, giving them different permissions.
Note
Alike Github Organization and Repository
There are two ways to add API services to the project team on the UtilMeta platform:
- Use UtilMeta framework or the framework supported by UtilMeta for development. You can connect the platform with one command after adding configuration code.
- For other API services, you can import the OpenAPI document to add the service.
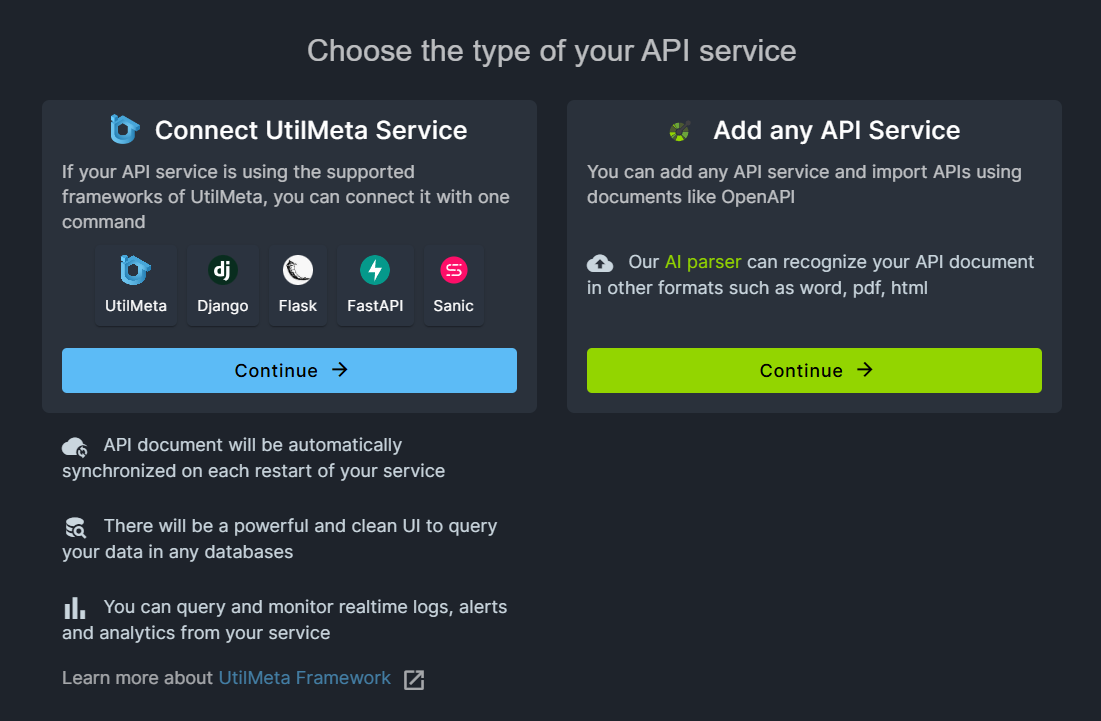
Each API service connected to the UtilMeta platform supports the following features
- Debuggable API Documentation
- Write and execute API unit tests
- View the test logs of the API
- Set up Dial Monitoring and Alerting for API (coming soon)
The API service that uses the UtilMeta framework (or other supported framework) to connect to the platform is called UtilMeta node, the OperationsAPI provided by the operations system of the UtilMeta framework enables UtilMeta nodes to have server-side observation and reporting capabilities. so the UtilMeta node has the following additional capabilities over the normal API services
- Real-time server side logs query
- Data management CRUD (requires using the supported ORM library, Django for now)
- Real API requests Statistics and Analysis
- Real-time monitoring of server resource performance and occupancy
- Server-side conditional alerts and notifications (coming soon)
API
Click the API in the left drawer to enter the API management section of the platform
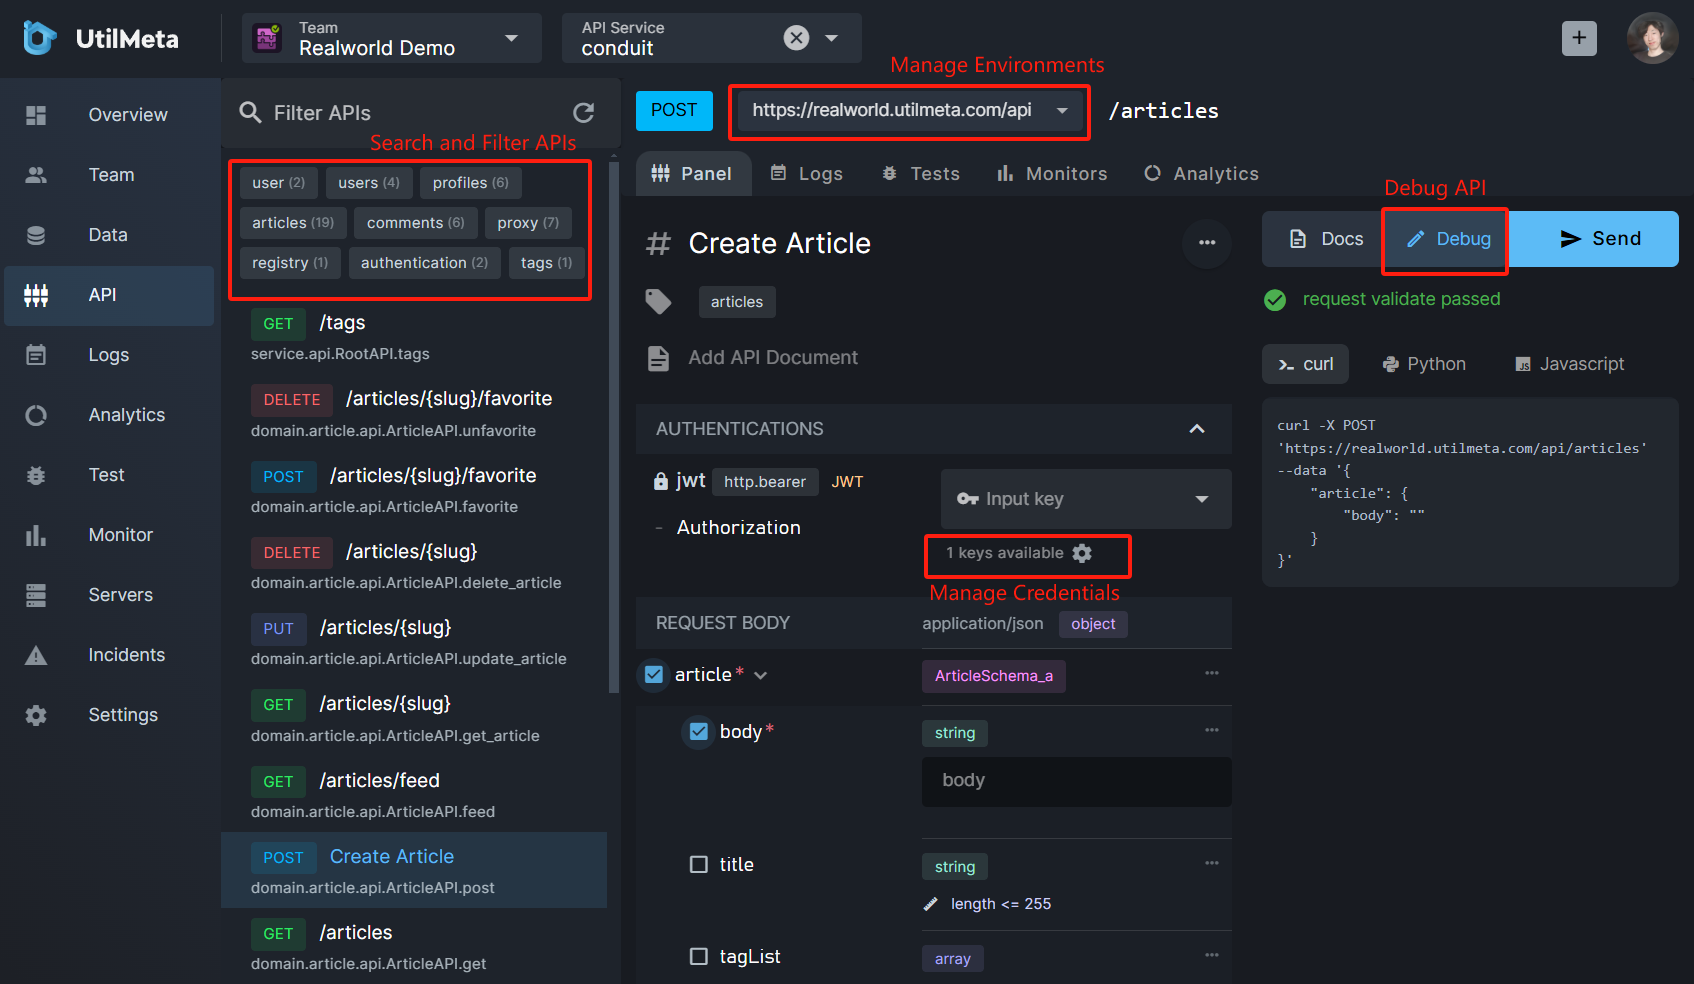 In the API list on the left, you can search or filter APIs using tags. Click the interface to enter the corresponding interface document. Click the Debug button on the right to enter the debugging mode. You can enter parameters and send a request. The right side will automatically synchronize the curl, python and JavaScript request codes corresponding to the parameters.
If your API includes authentication, the credentials can also be managed on the UtilMeta platform.
Tip
For localhost node and un-login user, the requests will be sent from your browser, so if the API does not enabled CROS settings, the result cannot be shown due to the constraints of the browser
Data
Click the API in the left drawer to enter the data management section of the platform
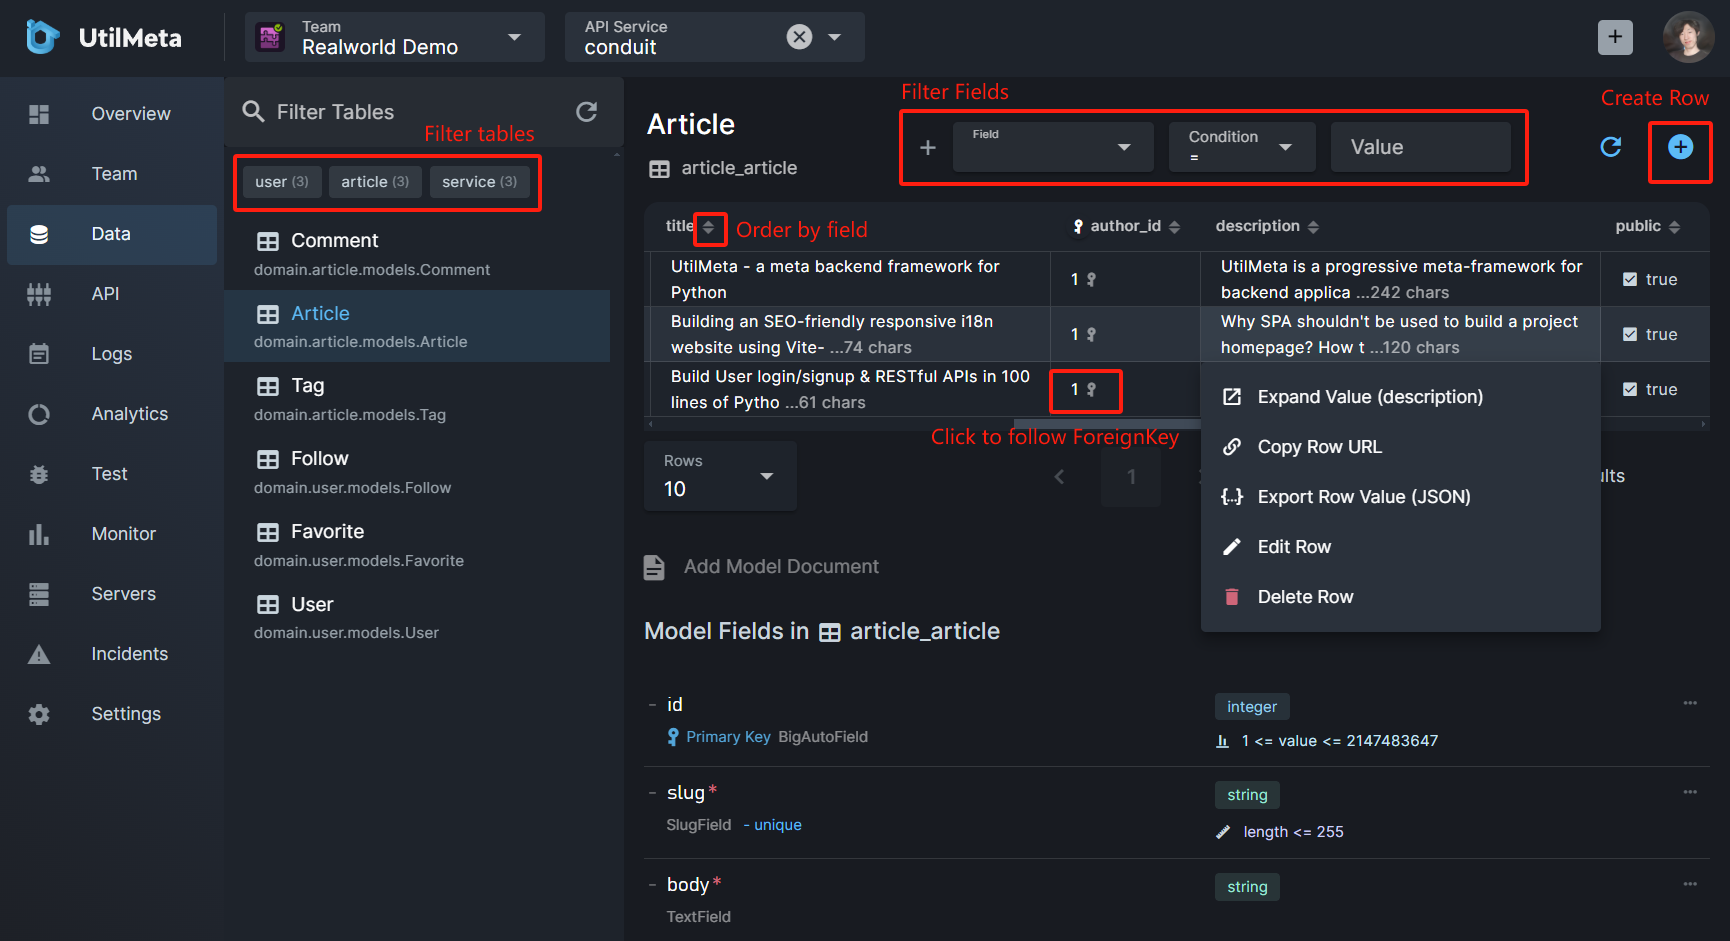 The model (table) list on the left can be searched or filtered using tags. After clicking the model, the table structure and table data will be displayed on the right. You can add multiple field filters in the field query bar above. Each field in the table also supports ascending and descending sorting.
Each data cell in the table can be Left-click or right-click to expand the options menu. you can expand the data that is too large to display completely. Users with permission can also edit or delete the selected data row. Click the + button in the upper right corner to create a new data instance
Below the query table is the table structure document of the model, which will display the name, type, properties (primary key, foreign key, unique, etc.) and validation rule of the model field in detail
You can specify a secret_names parameter when configuring the Operations system. When the table field name contains any one of the names in secret_names, the corresponding result returned by the data query will be hidden ( '******'). The default value of secret_names can refer to the above configuration section
Logs
Click the Log in the left drawer to enter the log query section of the platform
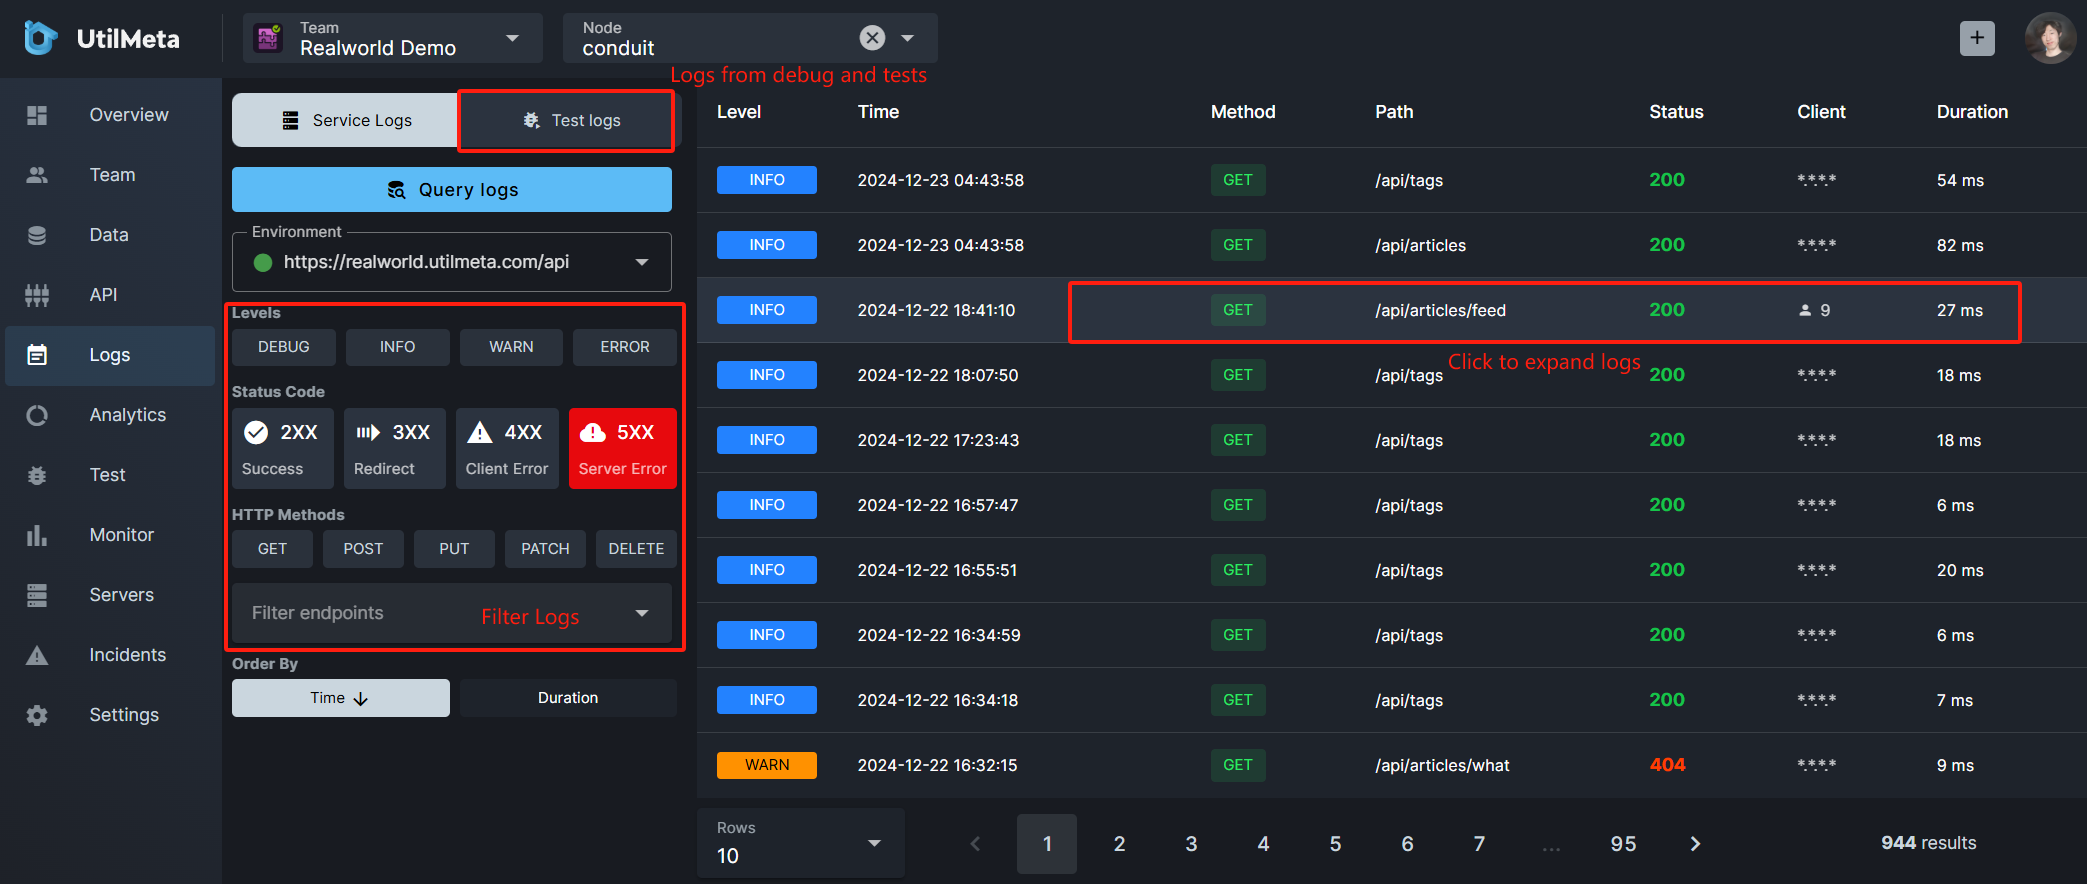 The left side is the filters of the log, and the options at top can switch the log panel:
- Service Logs: Server-side real request logs
- Test Logs: Debug and test logs initiated on the UtilMeta platform
Filtering options at the left side include log levels, response status codes, HTTP methods, and API paths, and can be sorted by request time or processing time
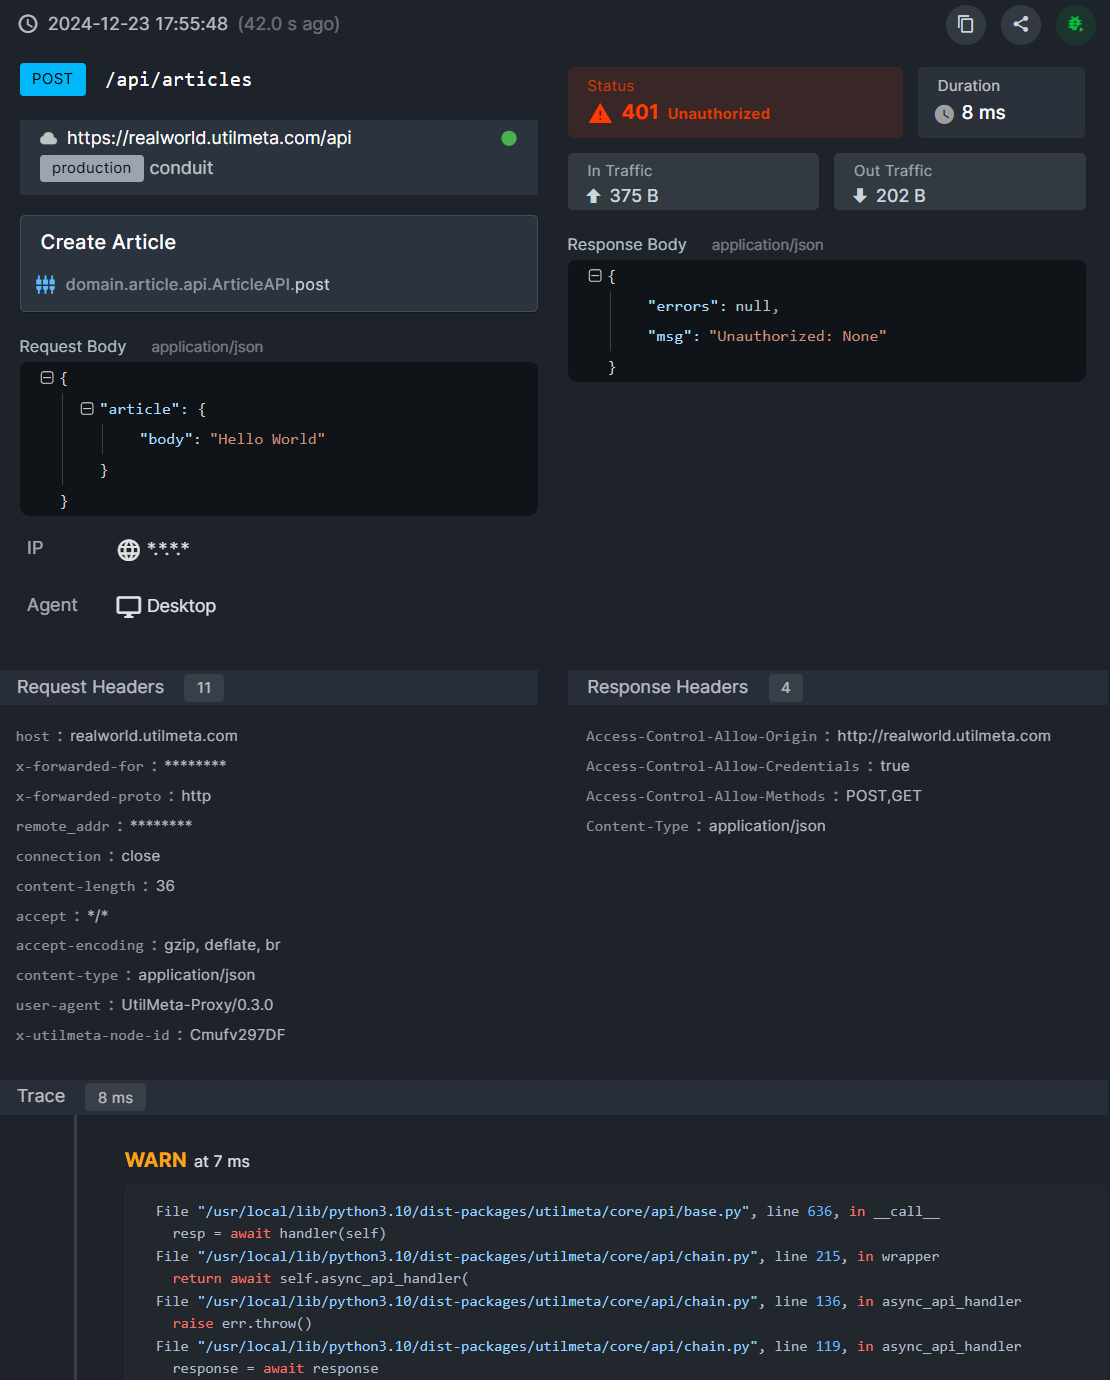
Click a single log to expand the log details. The log will record the request and response information, exception call stack and other data in detail.
Servers
Click the Servers in the left drawer to enter the service monitoring section of the platform
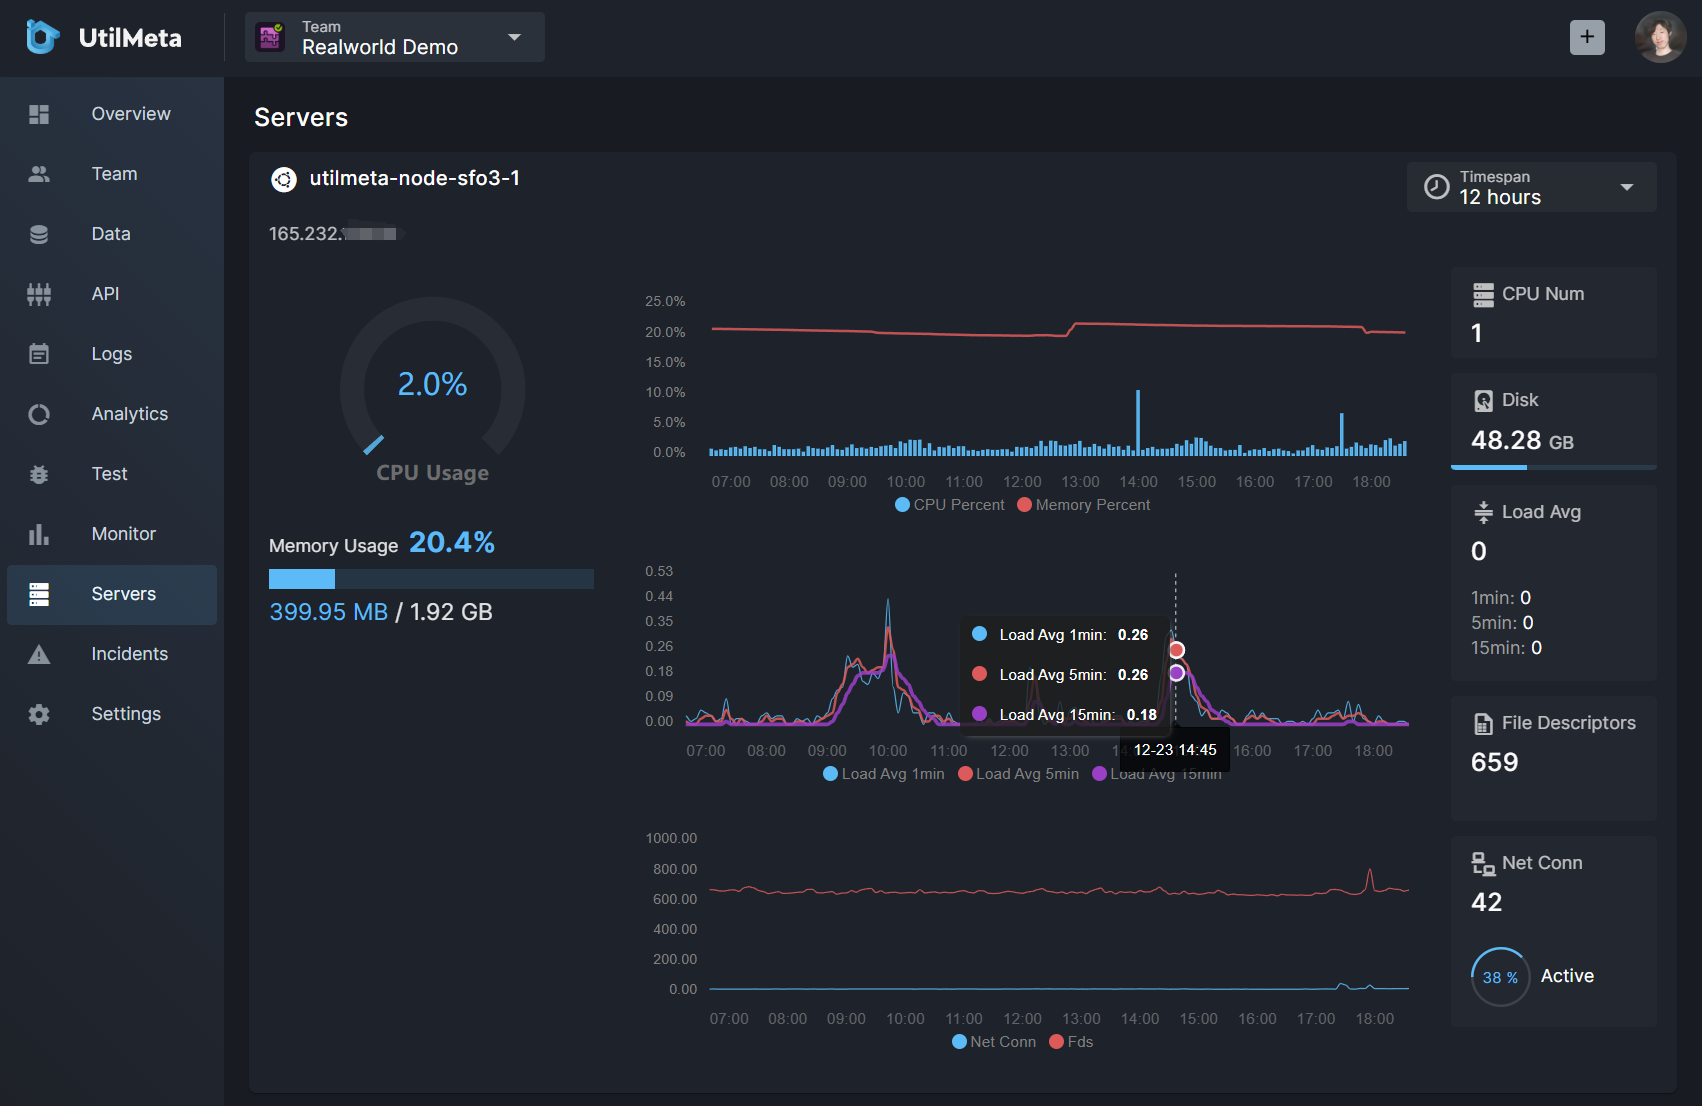 It can monitor the CPU, memory usage, Load Avg, file descriptors and network connections in real-time of the server where the API service is deployed.
The time range option in the upper right corner allows you to select the time span of the data query
Authorization and Authentication
The authorization of observation and management operations of UtilMeta platform is based on the credentials flow of OAuth2 protocol.
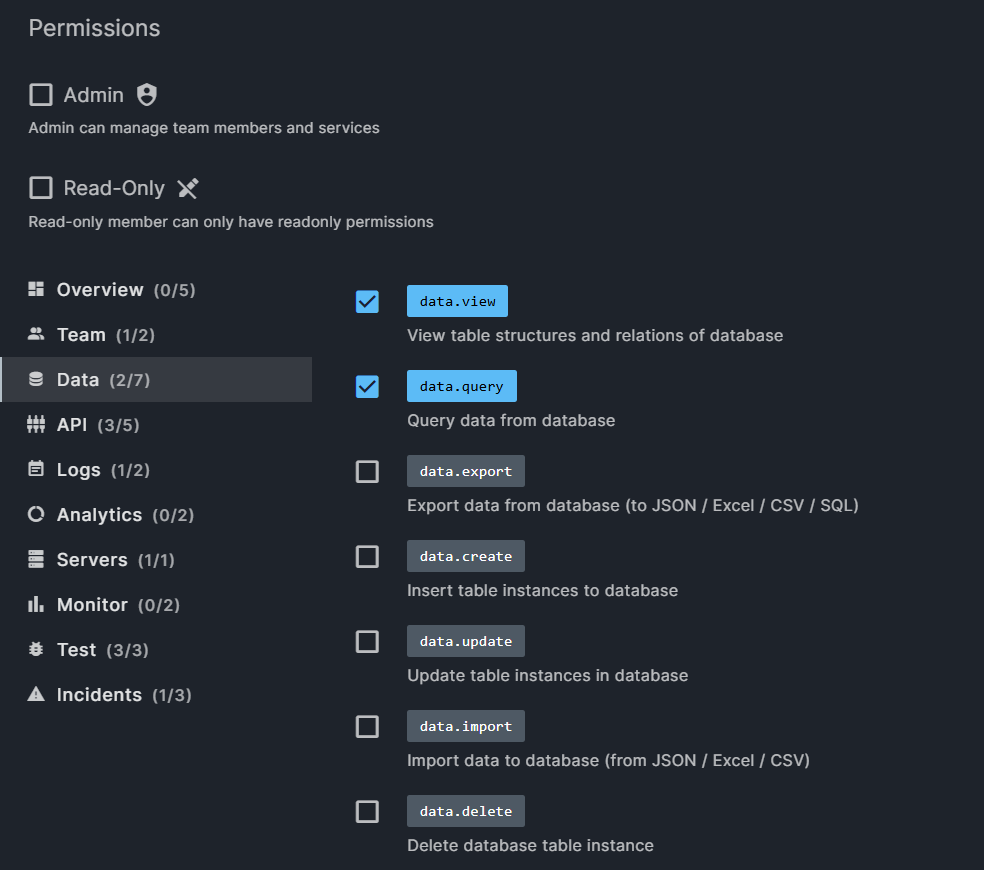
The server-side management capabilities provided by the UtilMeta node, such as data management, logging, and monitoring queries, are implemented by directly calling the OperationsAPI of the node. The client (such as browser) of the UtilMeta platform will first request the UtilMeta platform for a OAuth access token containing the corresponding permission. If the platform verifies that the user has the corresponding permission in the team where the API service is located, it will authorize it. Otherwise, it will reject it
Tip
Team admin can add or edit member permissions in the Team block
After a successful authorization, the client of the UtilMeta platform will carry the access token to initiate an observation or management request to the OperationsAPI of your service. The OperationsAPI will parse and authenticate the access token and execute the legitimate request.
Note
In addition to the basic process of OAuth2, the authorization mechanism of the UtelMeta platform also includes real-time permission synchronization. For example, when you revoke a member's permission on the UtelMeta platform, the platform will synchronize it to all service nodes, revoke all access tokens that have been authorized to the user but have not expired, and immediately invalidate the access tokens generated by the corresponding user. This makes the entire distributed permission system respond and take effect in real-time